
 Every year WeddingWire puts out a survey to newly wed couples. This year, They surveyed more than 13,000 couples that wed in 2016 to learn about their weddings and what was most important to them.
Here are some of the big changes:
1. Technology matters: Couples now spend 50% of their time planning from a smartphone (up from 30% last year).
2. Uniformity is out: Bridesmaids are more likely to wear non-matching than in previous years, a trend we’ve seen continue to grow.
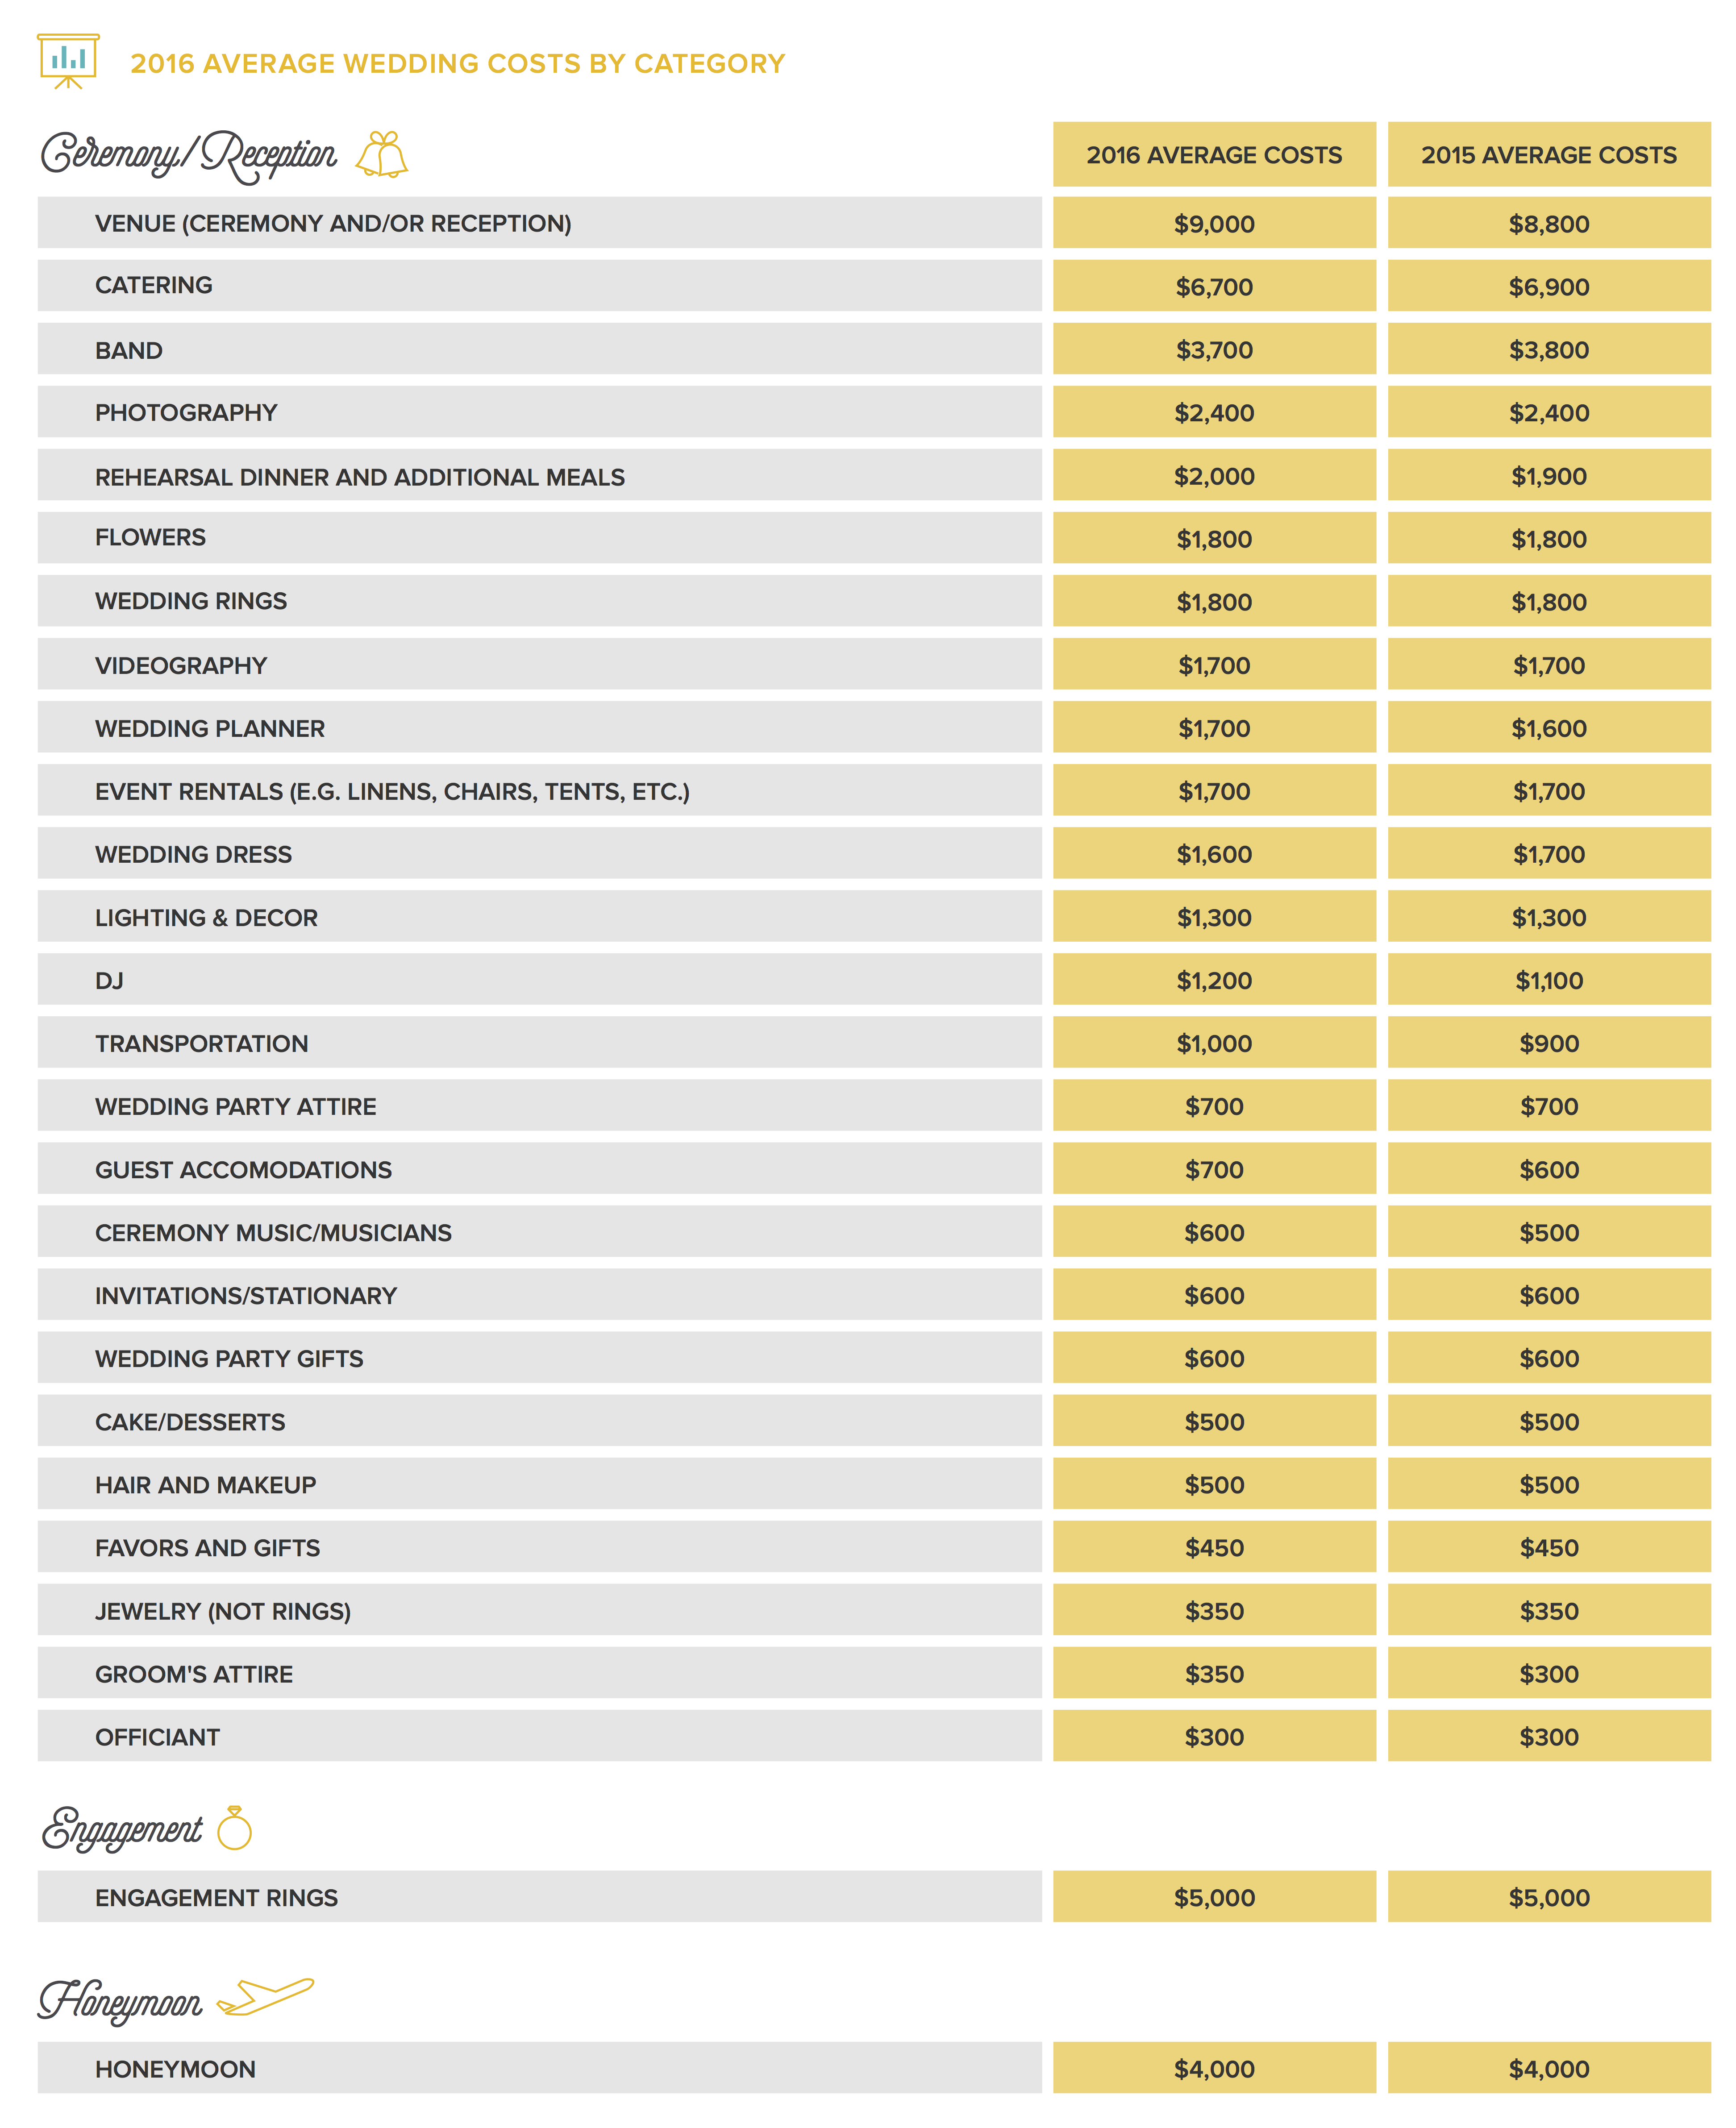
3. While the average wedding price tag hasn’t grown, millennials spend a bit more: $31,000 on average.
But, some things are staying put:
1. The average price of a wedding is still about $28,000. Spend on honeymoons ($4,000) and engagement rings ($5,000) is also about the same as last year.
2. The first dance continues to be the most popular tradition for all couples, but same-sex couples are less likely to perform one.
3. The average number of wedding guests for straight couples is 124, just four more than last year. For same-sex couples, it’s 100.

- Christmas Day (12/25)
- Valentine’s Day (2/14)
- Christmas Eve (12/24)
- New Year’s Day (1/1)
- New Year’s Eve (12/31)
- Day before Valentine’s Day (2/13)
- December 17th (Saturday before Christmas Eve)
- December 10th (2 Saturdays before Christmas Eve)
- December 23rd
- Independence Day (7/4)
In 2016, 15% of all engagements happened on the same 10 days.
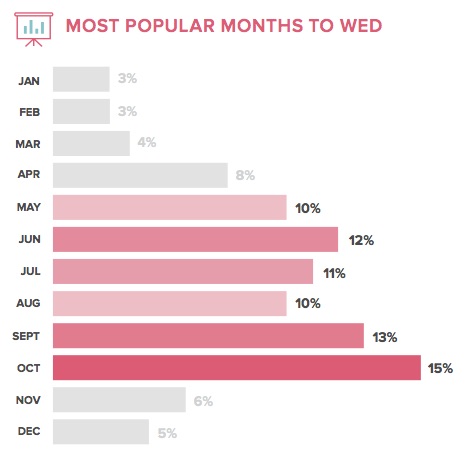
Twenty-two dates make up 50% of all weddings in 2016
Top 5 Most Popular Wedding Dates
*October 22 *October 15
*October 8 *November 5
*September 24
What to Wear:
60% of grooms dress in a suit or more casual look
70% wear something old, new, borrowed and blue
46% of bridesmaids wear the same dress
Average Price of Attire:
Wedding Dress- $1600
Grooms Attire- $350